So I’m a little too obsessed with typing
Full-stack web app that generates a “Spotify Wrapped” style visualization of typing stats from MonkeyType data.
I’m obsessed with typing. I spend way too much time on MonkeyType clawing at my keyboard. But how much time exactly? 16 hours, 9 minutes and 51 seconds. That’s 968 tests and 47,841 words, and I had no good way to visualize any of it. So I built one: MonkeyType Wrapped, a “Spotify Wrapped” for typists.
Not another dashboard
The goal was never to build a boring dashboard full of metrics you already know. Your average WPM is right there on MonkeyType, and putting it in a bigger font doesn’t tell you anything new. I wanted to use the data to get at the things you can’t see from the test screen: patterns, habits, and the shape of how you actually type over hundreds of sessions.
Finding your typing style with K-means
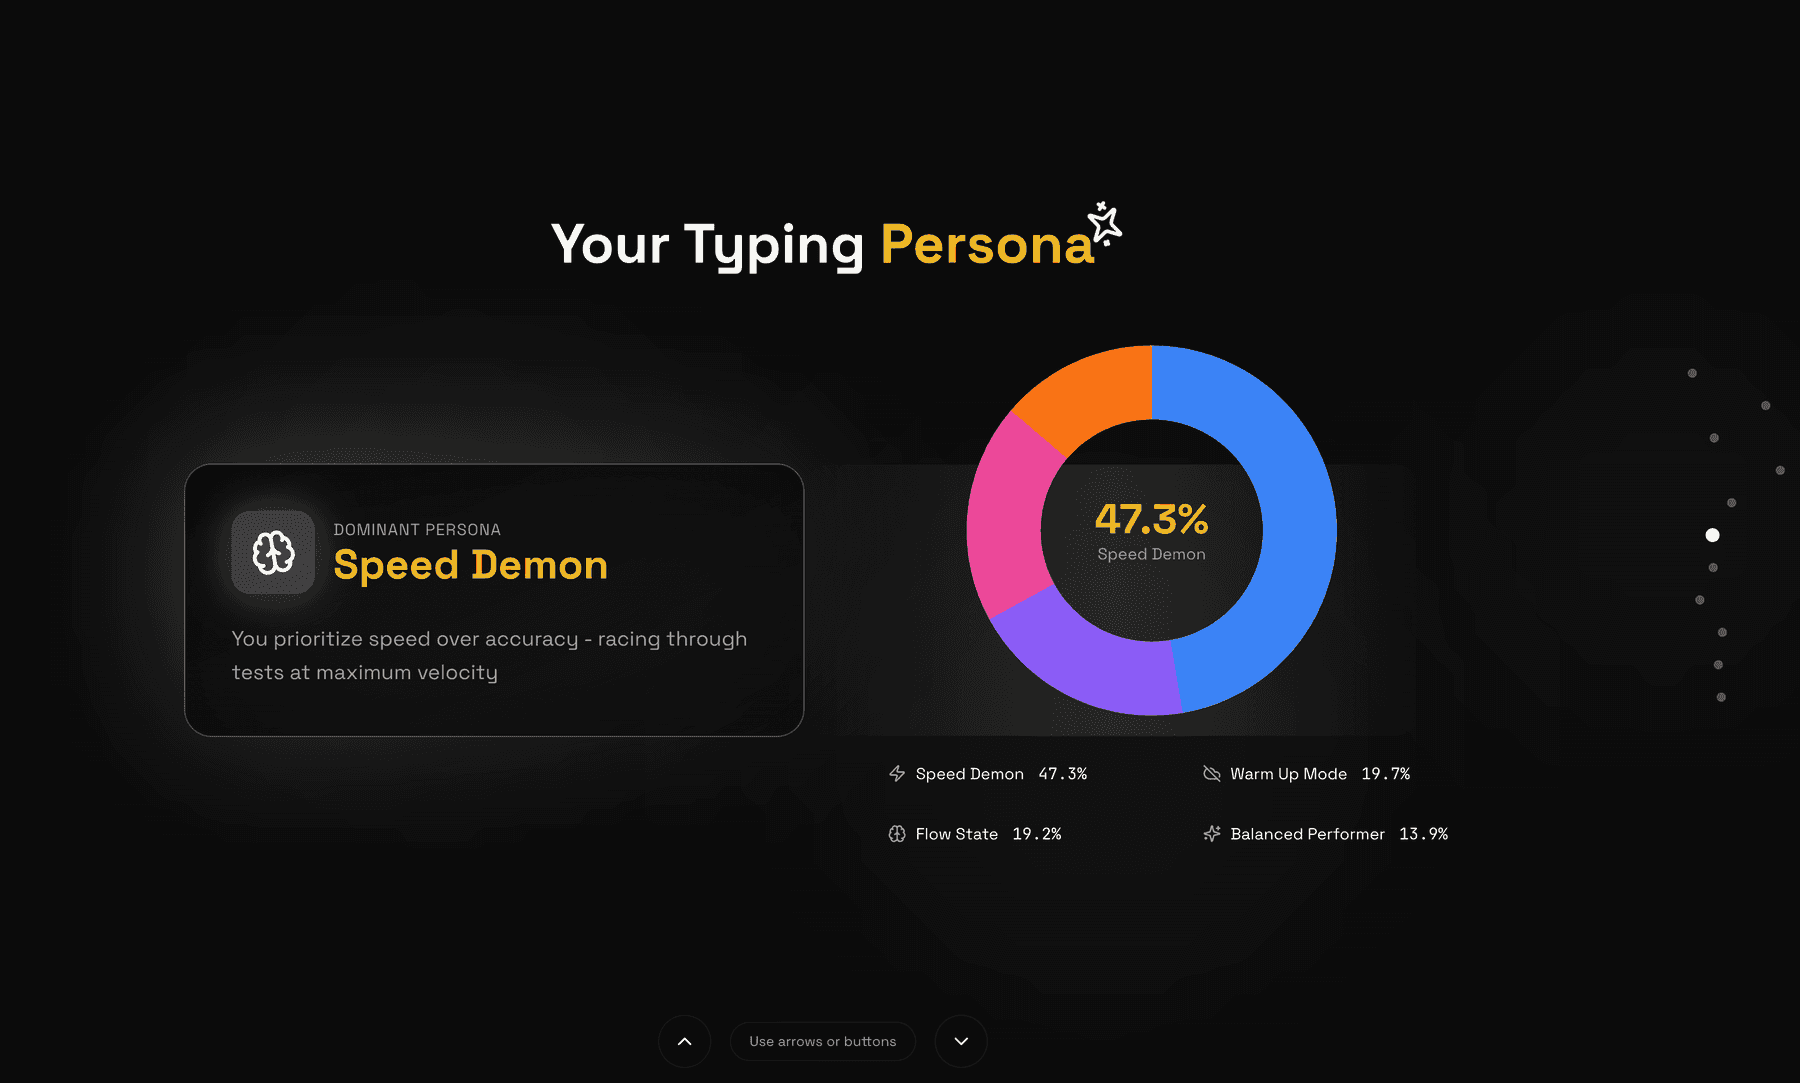
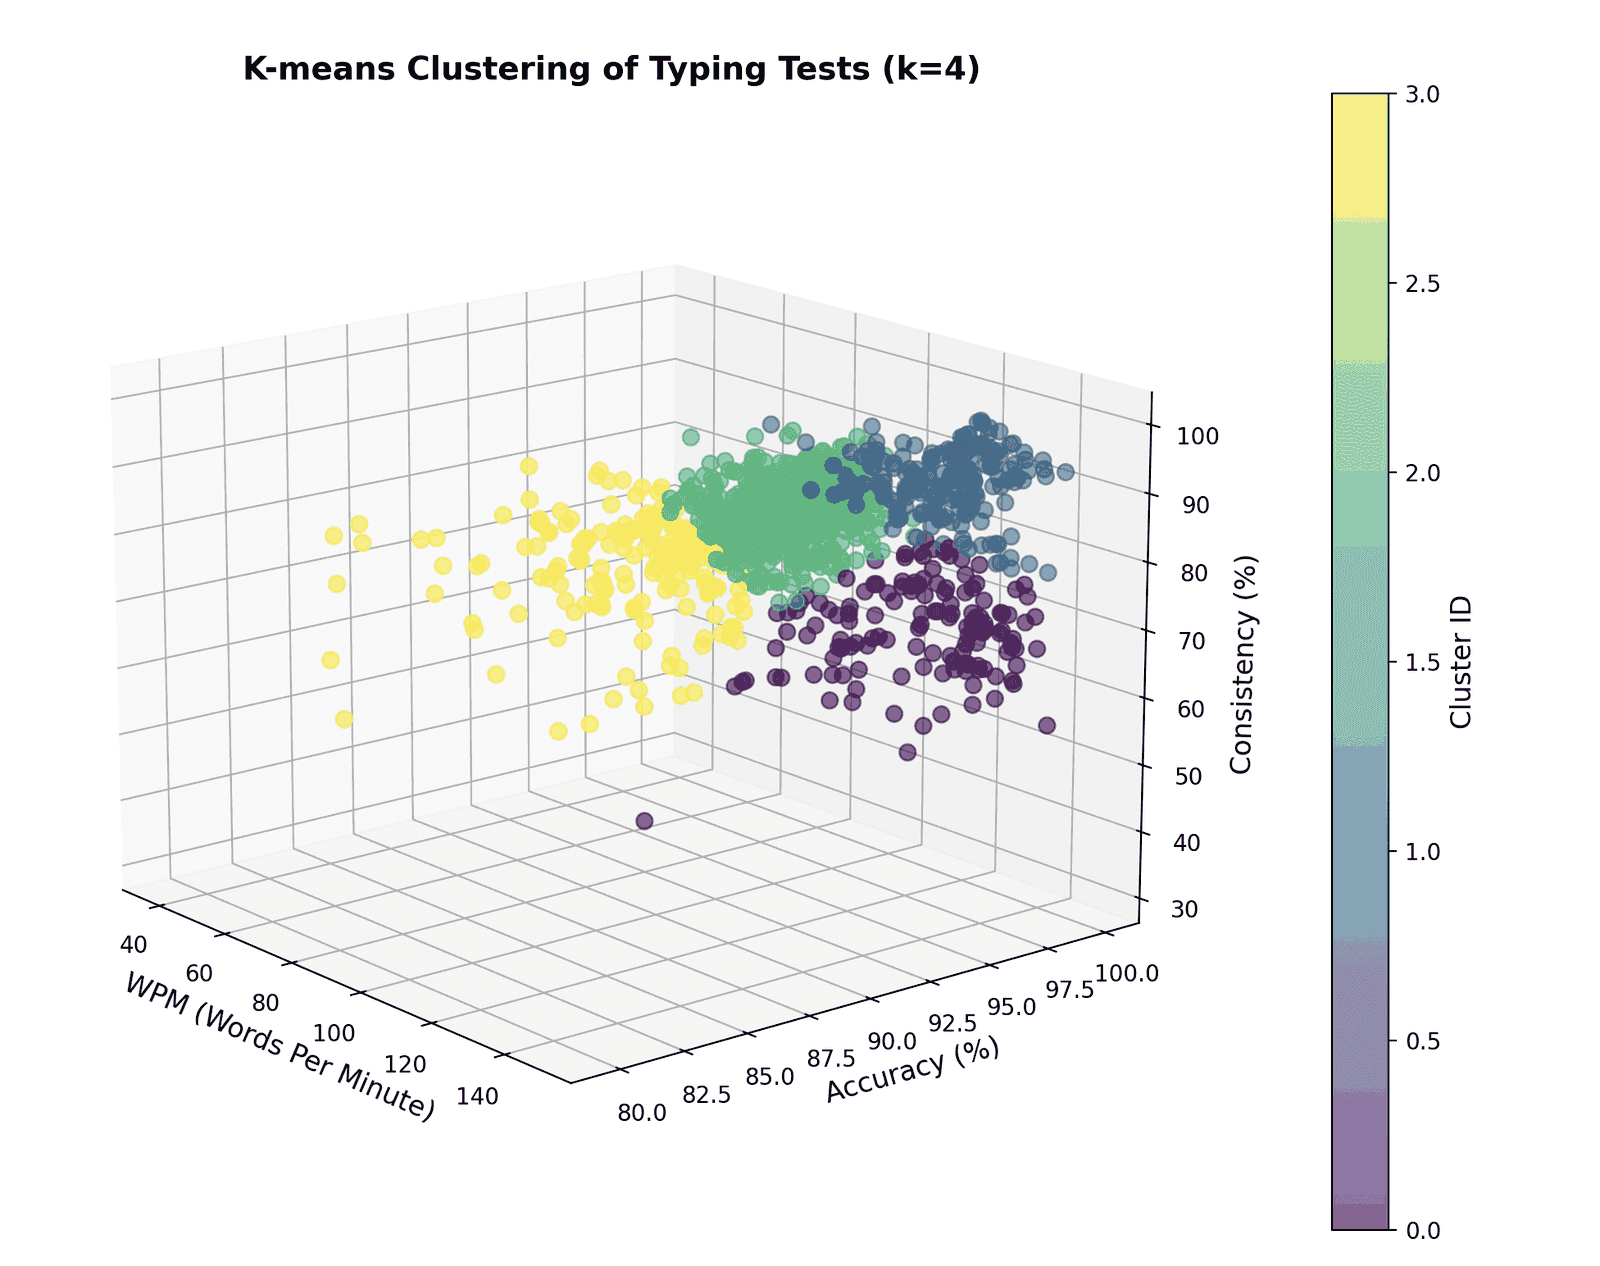
The centerpiece is a K-means clustering model running over a 3D feature space (WPM, accuracy, and consistency) normalized with StandardScaler so no single axis dominates the distance calculation. It groups every test you’ve ever taken into four clusters, which line up with four recognizable ways of typing: fast and sloppy, still warming up, locked into a flow state, and balanced across the board.
features = df[["wpm", "accuracy", "consistency"]]
scaled = StandardScaler().fit_transform(features)

kmeans = KMeans(n_clusters=4, random_state=42, n_init=10)
df["cluster"] = kmeans.fit_predict(scaled)
Trends, streaks, and personal bests
For everything time-shaped I leaned on Pandas: .diff() for test-over-test movement, .cumsum() for running totals, and a pass over the dataset to pull out personal best progressions: not just your current PB, but every time you broke the old one and how long each record stood.
The stats you actually want
Then there’s the fun half, the numbers that make you laugh at yourself:
- How many times you rage restarted mid-test
- Your favorite mode, by a much wider margin than you’d guess
- How your accuracy holds up when you type fast versus slow
How it’s put together
The frontend is Next.js 14 and TypeScript with Framer Motion driving the animated, story-style reveal. The backend is FastAPI, with Pandas, NumPy, and scikit-learn underneath. Frontend on Vercel, backend on Railway. The decisions that actually mattered:
- The backend is six analysis modules, each with a single entry point. None of them share state, so there was no reason to share a module. The payoff is that adding a stat means adding a file rather than threading it through existing code, and when one analysis throws on weird input I can catch it and drop that slide instead of failing the whole Wrapped.
- There’s no database: the API is stateless. Your CSV is parsed in memory, analysed, and gone by the time the response is sent. I started there to avoid running a database for a side project, but it turned into the better answer anyway. There is nothing to leak because nothing is kept, which matters when you are asking strangers to upload a file, and the backend scales by adding instances since no request depends on any other.
- Responses are typed end to end. Every analysis returns a deeply nested JSON object, and the frontend renders a different slide for each one. Typing those shapes meant that renaming a field on the Python side surfaced as a compile error instead of a slide quietly rendering undefined, which is exactly the kind of bug that survives to production because nothing crashes.
- The slides are client state, not routes. Real page navigations would tear down and rebuild the component tree between slides, which kills the transition and refetches the analysis every time. Keeping the whole flow in client state lets Framer Motion animate between slides and means the upload is processed exactly once.
- Every analysis assumes the data is broken. Real exports are messier than mine: new accounts with a dozen tests, people who only ever run 15 second sprints, older exports missing columns entirely. Each analysis checks it has enough samples before it computes anything, and returns a not-enough-data state rather than a divide-by-zero. K-means is the strictest case, since it needs more points than clusters before it will run at all.
- Clusters get persona names, not IDs. K-means hands you integers, and “Cluster 2” means nothing to anyone. Each cluster is named after where its centroid sits in the WPM, accuracy, and consistency space, so the output reads as a description of how you type instead of a label from a model. The clustering is identical either way. The naming is the entire difference between a result and an insight.